PSI: The Metric That Catches Model Drift Before Your 30+ DPD Report Does
The 30+ DPD report that hits your desk on the 5th of every month? That's the autopsy. By the time delinquency numbers spike, the damage is already baked into your portfolio. In Nigerian digital lending, the average lag between origination and 30+ DPD is 45 days. In Kenyan salary advance products, it's closer to 60 days when you factor in payday cycles.
Population Stability Index monitoring changes that timeline. Instead of waiting six weeks for proof that your model has drifted, you catch the shift within 48 hours of disbursement. This isn't theoretical. It's the difference between a correctable 3% uptick in approvals-to-bad and a 15% portfolio blowup that requires emergency tightening.
TL;DR:
- PSI measures whether your current applicants still resemble the population your model was trained on. If they don't, your predictions are unreliable.
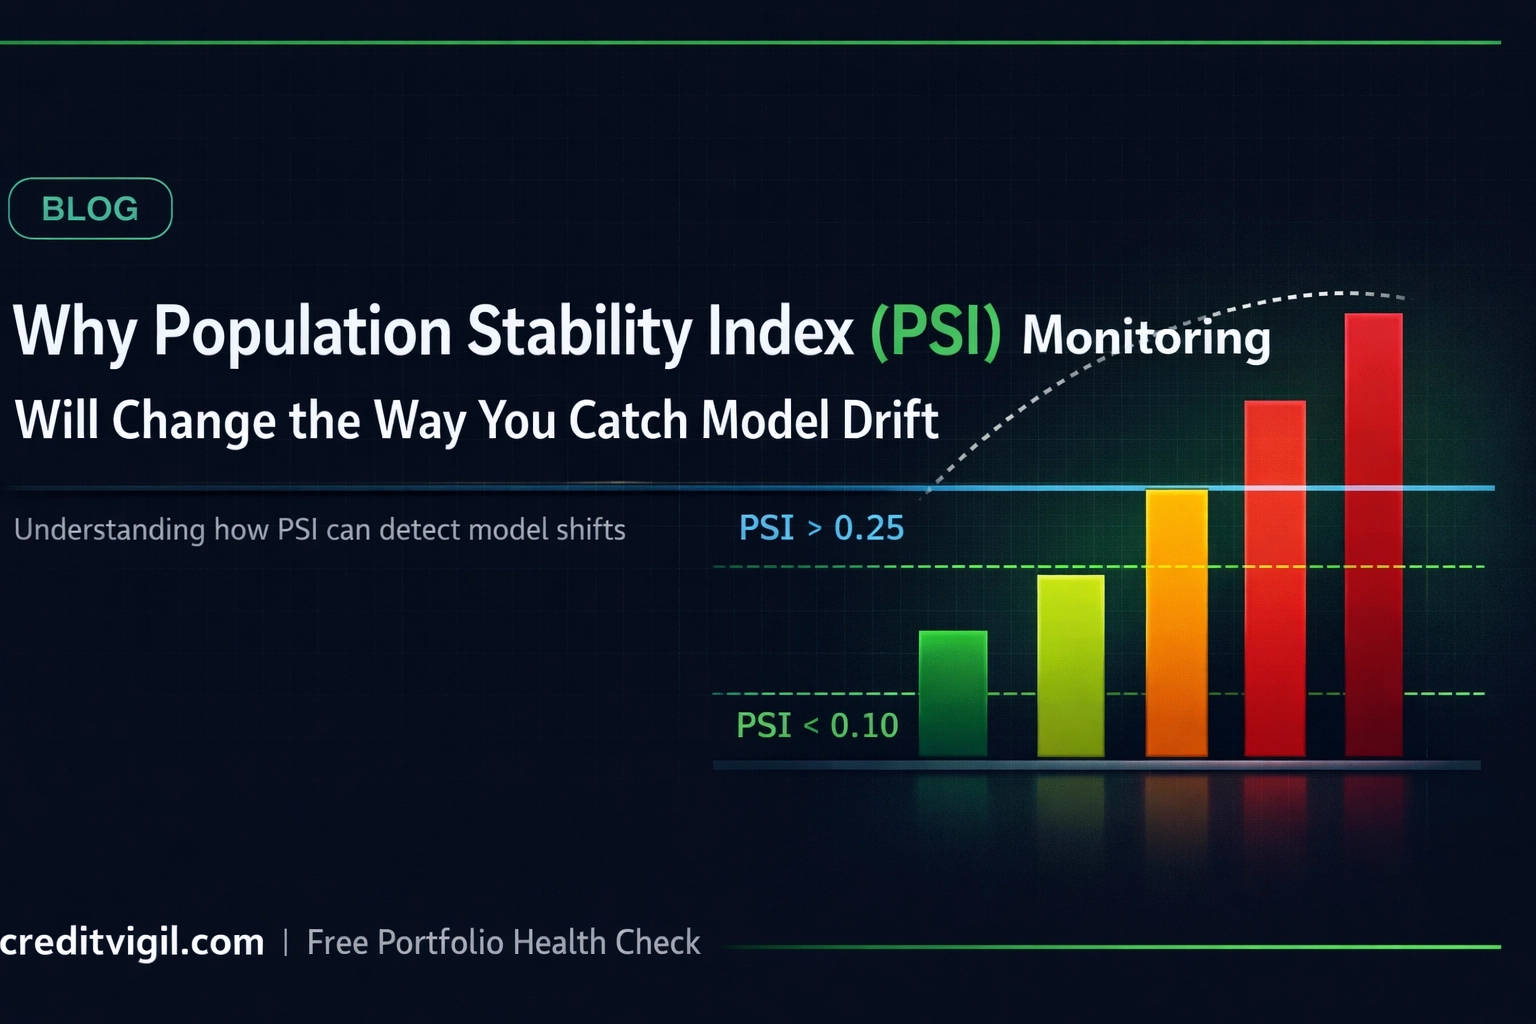
- Three thresholds: below 0.10 (stable), 0.10–0.25 (investigate), above 0.25 (act immediately).
- You can start tracking PSI this week with nothing more than your training scores and a weekly production extract.
What PSI Actually Measures
PSI quantifies how much your current applicant population differs from the population your model was trained on. No black boxes, no complex statistical theory required for interpretation.
You bin your model's score distribution from training data (baseline) and compare it to your current production scores. For each bin, PSI calculates the divergence using:
PSI = Σ (P_i − B_i) × ln(P_i / B_i)
Where P_i is the percentage of current production records in bin i, and B_i is the percentage of baseline records in the same bin. The formula produces a single number that tells you whether your incoming borrowers still look like the borrowers your model learned from. If they don't, your predictions are unreliable.
This matters acutely in African markets where borrower behavior shifts rapidly. When Nigeria's CBN changed FX policy in June 2023, salaried workers' disposable income profiles changed overnight. When Kenya's Hustler Fund launched in 2022, it changed how certain segments approached digital credit. A model trained on pre-shift data can't price post-shift risk accurately.
The Only Three Numbers You Need to Remember
PSI interpretation uses fixed thresholds that are widely accepted as industry standard and hold across most lending contexts:
| PSI Range | Status | Action | |-----------|--------|--------| | < 0.10 | Stable | Current applicants match your training distribution. Continue monitoring. | | 0.10 – 0.25 | Moderate drift | Investigate which features are driving the change. Yellow flag. | | ≥ 0.25 | Significant drift | Model is operating outside trained parameters. Investigate before relying on outputs. |
PSI < 0.10: Your population is stable. Current applicants match your training distribution. No action needed beyond continued monitoring.
PSI 0.10 to 0.25: Moderate drift detected. Your population has shifted enough to warrant investigation. Check which features are driving the change. This is your yellow flag: not an emergency, but not ignorable.
PSI ≥ 0.25: Significant drift. Your model is operating outside its trained parameters. Stop relying on its outputs until you understand what changed and whether recalibration or retraining is required.

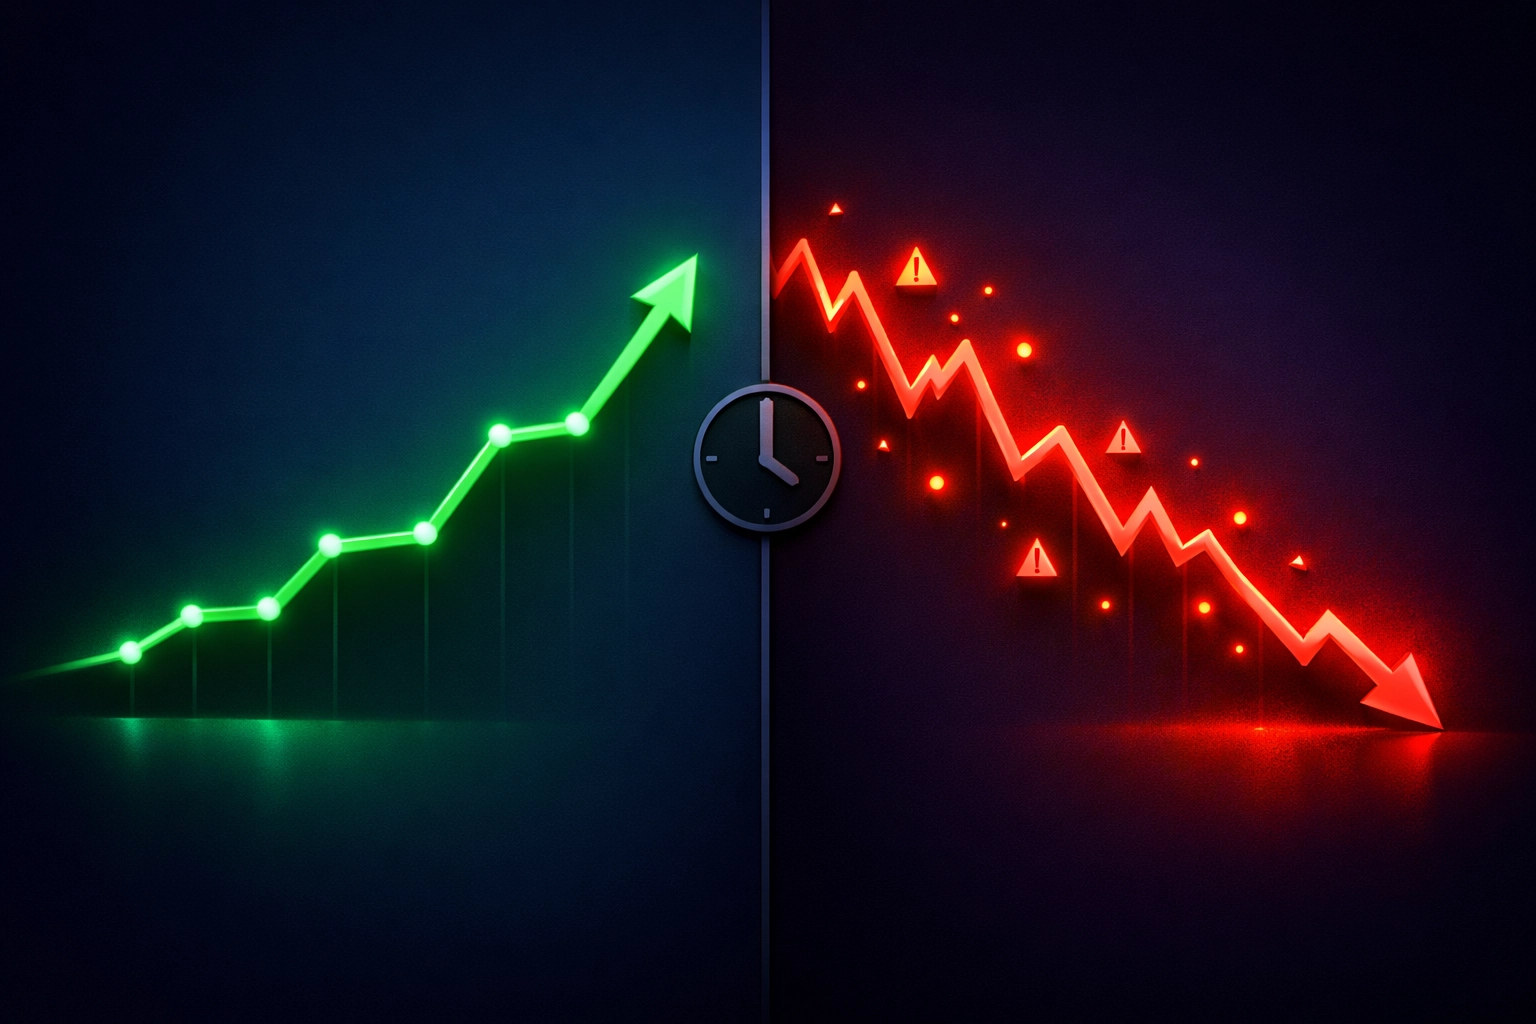
Why PSI Catches Problems Before Your 30+ DPD Report Does
Traditional model monitoring waits for performance degradation to show up in outcomes. You track Gini coefficient on monthly vintages, watch KS statistics decline, or wait for default rates to tick up. All of these are lagging indicators.
PSI is a leading indicator because it measures input drift, not output performance. When your applicant mix shifts — more applicants from informal employment, different age distributions, changed income brackets — PSI flags it immediately. You don't need to wait for those loans to age into delinquency to know something changed.
Consider a pattern that repeats across African digital lenders: a competitor launches an aggressive acquisition campaign in your core market. Your approval rate drops from 35% to 28% over two weeks as cherry-picked good borrowers flow elsewhere. Your model doesn't deteriorate — your denominator changes. Applications skew toward higher-risk profiles.
A PSI spike to 0.18 tells you this happened before a single loan from that period reaches 30+ DPD. You have time to adjust underwriting cutoffs, rebalance acquisition channels, or tighten specific segments. Without PSI, you discover the problem eight weeks later when vintage 10 performs worse than vintage 9, and by then you've disbursed another NGN 200 million or KES 150 million into a shifted population.
What Drives PSI Spikes in African Lending
Four scenarios consistently trigger PSI alerts in African credit portfolios:
Channel mix shifts: When your ratio of organic-to-paid applicants changes, PSI catches it. Paid acquisition through Facebook or Google often brings different risk profiles than organic referrals or employer integrations. If your acquisition team runs an experimental campaign in a new geography or demographic, PSI will flag the population change even if individual scores seem reasonable.
Regulatory or macroeconomic shocks: CBN interest rate changes, CBK digital lending guideline updates, or forex policy shifts change borrower behavior within days. PSI monitoring caught the post-CBN-naira-float drift at multiple Nigerian lenders before their monthly risk committee meetings even convened.
Seasonality that your training data didn't capture: If you trained a model in Q1 and deployed it in Q4, you might hit seasonal patterns that weren't in your baseline. December in Kenya looks different from March — salary structures, side hustles, holiday spending. PSI quantifies that difference.
Product changes: Added a new loan amount tier? Changed your maximum tenor? Started accepting a new employer segment? PSI will show you whether those product decisions attracted a population your model understands.
Your Monday Morning PSI Workflow
Running PSI monitoring doesn't require a data science PhD or dedicated model ops infrastructure. Here's the practical checklist:
Monday morning (Week 1 setup):
- Pull your model training dataset scores. Bin them into 10 equal-sized groups (deciles work, but 10 bins is standard).
- Calculate the percentage of your training data in each bin. Save this as your baseline distribution.
- Set up a weekly extract of production scores from the past seven days.
Every Monday after that:
- Bin your production scores from the previous week using the same bin edges as your baseline.
- Calculate the percentage of production data in each bin.
- Compute PSI using the formula above.
- Log the result in a tracking sheet or dashboard.
When PSI hits 0.10+:
- Break down PSI by feature. Calculate PSI for each input variable independently. Identify which features shifted most.
- Check your acquisition channels. Did traffic sources change? Did a marketing campaign alter applicant mix?
- Review recent product or policy changes. Did anything in your application flow or eligibility criteria update?
When PSI hits 0.25+:
- Pause and investigate before taking further action. Do not continue automated decisioning until you understand what changed.
- Compare score distributions visually. Plot baseline versus current to see exactly where the divergence occurs.
- Assess whether the shift is temporary (campaign-driven, seasonal) or structural (market change, new competitor).
- If structural, retraining is likely required. If temporary, consider temporary cutoff adjustments rather than full model rebuild.

The Feature-Level Advantage
The most powerful aspect of PSI isn't the overall number — it's that you can calculate it independently for every input variable. This gives you diagnostic precision.
When overall PSI spikes to 0.22, you don't just know your population drifted. You know which features drifted. Maybe age distribution is stable (PSI 0.03) but employment_type shifted hard (PSI 0.41). That tells you exactly where to look.
In Nigerian lending, employment_type drift is common. The ratio of salaried formal workers to informal traders in your applicant pool can shift based on economic cycles or acquisition channel changes. If PSI flags that drift early, you can segment your scoring: apply the existing model to salaried workers (where it's still valid) while being more conservative on informal segments until you gather enough data to retrain.
In Kenyan markets, mobile money transaction patterns shift faster than other features. M-Pesa behavior during long holidays differs from normal months. Feature-level PSI helps you distinguish between meaningful drift (income profile changed) and noise (temporary spending patterns).
Why This Isn't Standard Practice Yet
Most African lenders monitor Gini coefficient, KS, and vintage performance. Few track PSI systematically. Two reasons explain the gap:
First, PSI requires storing baseline distributions. If your data infrastructure is immature — no data warehouse, no feature store — you can't easily compare current distributions to training distributions. This is solvable but requires basic data ops discipline.
Second, PSI alerts don't map directly to revenue impact like Gini degradation does. A 5-point Gini drop roughly translates to a quantifiable increase in bad loans. A 0.15 PSI spike means "something changed" but doesn't immediately quantify the cost. This makes it harder to justify to non-technical stakeholders. The reframe that works: PSI is early warning, Gini is damage assessment. By the time Gini confirms the problem, PSI could have caught it weeks earlier.
What Happens When You Ignore PSI
Portfolio blowups in African digital lending follow a predictable pattern. A lender trains a model on six months of data. The model performs well initially. Gini stays above 40%. Approval rates and default rates look stable.
Then the market shifts. A competitor exits, and you absorb their rejected applicants. Or the economy slows, and your borrower base skews toward riskier segments. Or your marketing team runs a campaign that changes applicant demographics.
None of this shows up in monthly Gini reports for 60 to 90 days. By the time 30+ DPD data confirms the problem, you've disbursed three months of loans into a population your model doesn't understand. The damage is permanent in those vintages.
PSI monitoring would have flagged the drift in week one. Not month three.
CreditVigil provides independent, real-time monitoring of credit scoring models for Africa's lenders. Request a free portfolio health check.